Referenzgrafiken für Dokument 1–3

Recherche vom 8. September 2026. Dies sind historische bzw. bestehende Lehrbuchgrafiken, noch keine fertigen Lernblätter. Fachliche Auswahlhinweise stehen in README.md. Alle fünf Bilder wurden visuell geprüft.

Dokument 1: Gruppen, Perioden und Elementfelder.
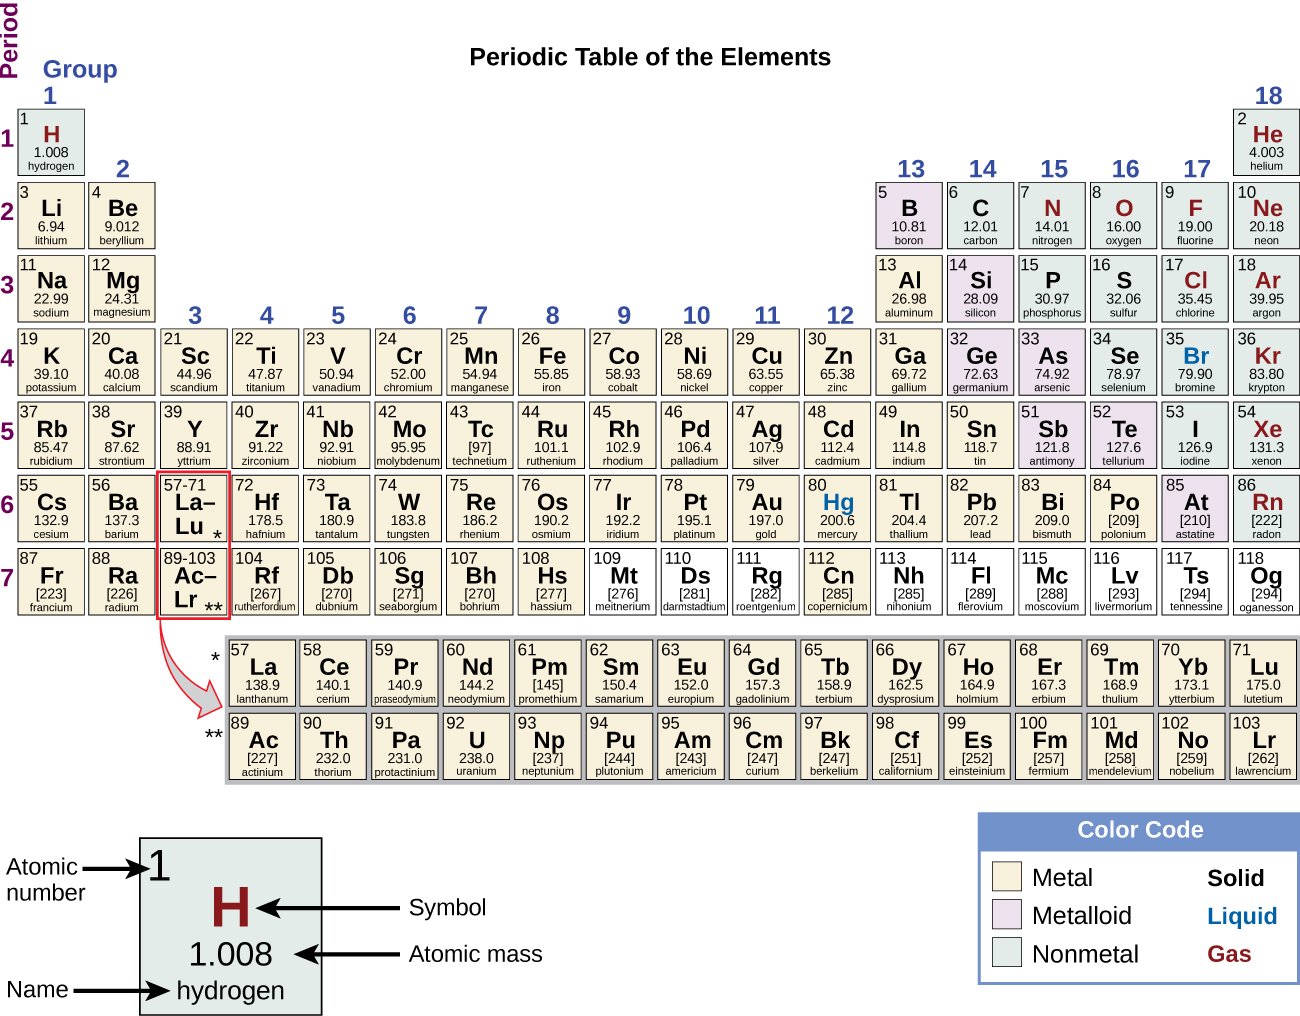
The Periodic Table of Elements is shown. The 18 columns are labeled “Group” and the 7 rows are labeled “Period.” Below the table to the right is a box labeled “Color Code” with different colors for metals, metalloids, and nonmetals, as well as solids, liquids, and gases. To the left of this box is an enlarged picture of the upper-left most box on the table. The number 1 is in its upper-left hand corner and is labeled “Atomic number.” The letter “H” is in the middle in red indicating that it is a gas. It is labeled “Symbol.” Below that is the number 1.008 which is labeled “Atomic Mass.” Below that is the word hydrogen which is labeled “name.” The color of the box indicates that it is a nonmetal. Each element will be described in this order: atomic number; name; symbol; whether it is a metal, metalloid, or nonmetal; whether it is a solid, liquid, or gas; and atomic mass. Beginning at the top left of the table, or period 1, group 1, is a box containing “1; hydrogen; H; nonmetal; gas; and 1.008.” There is only one other element box in period 1, group 18, which contains “2; helium; H e; nonmetal; gas; and 4.003.” Period 2, group 1 contains “3; lithium; L i; metal; solid; and 6.94” Group 2 contains “4; beryllium; B e; metal; solid; and 9.012.” Groups 3 through 12 are skipped and group 13 contains “5; boron; B; metalloid; solid; 10.81.” Group 14 contains “6; carbon; C; nonmetal; solid; and 12.01.” Group 15 contains “7; nitrogen; N; nonmetal; gas; and 14.01.” Group 16 contains “8; oxygen; O; nonmetal; gas; and 16.00.” Group 17 contains “9; fluorine; F; nonmetal; gas; and 19.00.” Group 18 contains “10; neon; N e; nonmetal; gas; and 20.18.” Period 3, group 1 contains “11; sodium; N a; metal; solid; and 22.99.” Group 2 contains “12; magnesium; M g; metal; solid; and 24.31.” Groups 3 through 12 are skipped again in period 3 and group 13 contains “13; aluminum; A l; metal; solid; and 26.98.” Group 14 contains “14; silicon; S i; metalloid; solid; and 28.09.” Group 15 contains “15; phosphorous; P; nonmetal; solid; and 30.97.” Group 16 contains “16; sulfur; S; nonmetal; solid; and 32.06.” Group 17 contains “17; chlorine; C l; nonmetal; gas; and 35.45.” Group 18 contains “18; argon; A r; nonmetal; gas; and 39.95.” Period 4, group 1 contains “19; potassium; K; metal; solid; and 39.10.” Group 2 contains “20; calcium; C a; metal; solid; and 40.08.” Group 3 contains “21; scandium; S c; metal; solid; and 44.96.” Group 4 contains “22; titanium; T i; metal; solid; and 47.87.” Group 5 contains “23; vanadium; V; metal; solid; and 50.94.” Group 6 contains “24; chromium; C r; metal; solid; and 52.00.” Group 7 contains “25; manganese; M n; metal; solid; and 54.94.” Group 8 contains “26; iron; F e; metal; solid; and 55.85.” Group 9 contains “27; cobalt; C o; metal; solid; and 58.93.” Group 10 contains “28; nickel; N i; metal; solid; and 58.69.” Group 11 contains “29; copper; C u; metal; solid; and 63.55.” Group 12 contains “30; zinc; Z n; metal; solid; and 65.38.” Group 13 contains “31; gallium; G a; metal; solid; and 69.72.” Group 14 contains “32; germanium; G e; metalloid; solid; and 72.63.” Group 15 contains “33; arsenic; A s; metalloid; solid; and 74.92.” Group 16 contains “34; selenium; S e; nonmetal; solid; and 78.97.” Group 17 contains “35; bromine; B r; nonmetal; liquid; and 79.90.” Group 18 contains “36; krypton; K r; nonmetal; gas; and 83.80.” Period 5, group 1 contains “37; rubidium; R b; metal; solid; and 85.47.” Group 2 contains “38; strontium; S r; metal; solid; and 87.62.” Group 3 contains “39; yttrium; Y; metal; solid; and 88.91.” Group 4 contains “40; zirconium; Z r; metal; solid; and 91.22.” Group 5 contains “41; niobium; N b; metal; solid; and 92.91.” Group 6 contains “42; molybdenum; M o; metal; solid; and 95.95.” Group 7 contains “43; technetium; T c; metal; solid; and 97.” Group 8 contains “44; ruthenium; R u; metal; solid; and 101.1.” Group 9 contains “45; rhodium; R h; metal; solid; and 102.9.” Group 10 contains “46; palladium; P d; metal; solid; and 106.4.” Group 11 contains “47; silver; A g; metal; solid; and 107.9.” Group 12 contains “48; cadmium; C d; metal; solid; and 112.4.” Group 13 contains “49; indium; I n; metal; solid; and 114.8.” Group 14 contains “50; tin; S n; metal; solid; and 118.7.” Group 15 contains “51; antimony; S b; metalloid; solid; and 121.8.” Group 16 contains “52; tellurium; T e; metalloid; solid; and 127.6.” Group 17 contains “53; iodine; I; nonmetal; solid; and 126.9.” Group 18 contains “54; xenon; X e; nonmetal; gas; and 131.3.” Period 6, group 1 contains “55; cesium; C s; metal; solid; and 132.9.” Group 2 contains “56; barium; B a; metal; solid; and 137.3.” Group 3 breaks the pattern. The box has a large arrow pointing to a row of elements below the table with atomic numbers ranging from 57-71. In sequential order by atomic number, the first box in this row contains “57; lanthanum; L a; metal; solid; and 138.9.” To its right, the next is “58; cerium; C e; metal; solid; and 140.1.” Next is “59; praseodymium; P r; metal; solid; and 140.9.” Next is “60; neodymium; N d; metal; solid; and 144.2.” Next is “61; promethium; P m; metal; solid; and 145.” Next is “62; samarium; S m; metal; solid; and 150.4.” Next is “63; europium; E u; metal; solid; and 152.0.” Next is “64; gadolinium; G d; metal; solid; and 157.3.” Next is “65; terbium; T b; metal; solid; and 158.9.” Next is “66; dysprosium; D y; metal; solid; and 162.5.” Next is “67; holmium; H o; metal; solid; and 164.9.” Next is “68; erbium; E r; metal; solid; and 167.3.” Next is “69; thulium; T m; metal; solid; and 168.9.” Next is “70; ytterbium; Y b; metal; solid; and 173.1.” The last in this special row is “71; lutetium; L u; metal; solid; and 175.0.” Continuing in period 6, group 4 contains “72; hafnium; H f; metal; solid; and 178.5.” Group 5 contains “73; tantalum; T a; metal; solid; and 180.9.” Group 6 contains “74; tungsten; W; metal; solid; and 183.8.” Group 7 contains “75; rhenium; R e; metal; solid; and 186.2.” Group 8 contains “76; osmium; O s; metal; solid; and 190.2.” Group 9 contains “77; iridium; I r; metal; solid; and 192.2.” Group 10 contains “78; platinum; P t; metal; solid; and 195.1.” Group 11 contains “79; gold; A u; metal; solid; and 197.0.” Group 12 contains “80; mercury; H g; metal; liquid; and 200.6.” Group 13 contains “81; thallium; T l; metal; solid; and 204.4.” Group 14 contains “82; lead; P b; metal; solid; and 207.2.” Group 15 contains “83; bismuth; B i; metal; solid; and 209.0.” Group 16 contains “84; polonium; P o; metal; solid; and 209.” Group 17 contains “85; astatine; A t; metalloid; solid; and 210.” Group 18 contains “86; radon; R n; nonmetal; gas; and 222.” Period 7, group 1 contains “87; francium; F r; metal; solid; and 223.” Group 2 contains “88; radium; R a; metal; solid; and 226.” Group 3 breaks the pattern much like what occurs in period 6. A large arrow points from the box in period 7, group 3 to a special row containing the elements with atomic numbers ranging from 89-103, just below the row which contains atomic numbers 57-71. In sequential order by atomic number, the first box in this row contains “89; actinium; A c; metal; solid; and 227.” To its right, the next is “90; thorium; T h; metal; solid; and 232.0.” Next is “91; protactinium; P a; metal; solid; and 231.0.” Next is “92; uranium; U; metal; solid; and 238.0.” Next is “93; neptunium; N p; metal; solid; and N p.” Next is “94; plutonium; P u; metal; solid; and 244.” Next is “95; americium; A m; metal; solid; and 243.” Next is “96; curium; C m; metal; solid; and 247.” Next is “97; berkelium; B k; metal; solid; and 247.” Next is “98; californium; C f; metal; solid; and 251.” Next is “99; einsteinium; E s; metal; solid; and 252.” Next is “100; fermium; F m; metal; solid; and 257.” Next is “101; mendelevium; M d; metal; solid; and 258.” Next is “102; nobelium; N o; metal; solid; and 259.” The last in this special row is “103; lawrencium; L r; metal; solid; and 262.” Continuing in period 7, group 4 contains “104; rutherfordium; R f; metal; solid; and 267.” Group 5 contains “105; dubnium; D b; metal; solid; and 270.” Group 6 contains “106; seaborgium; S g; metal; solid; and 271.” Group 7 contains “107; bohrium; B h; metal; solid; and 270.” Group 8 contains “108; hassium; H s; metal; solid; and 277.” Group 9 contains “109; meitnerium; M t; not indicated; solid; and 276.” Group 10 contains “110; darmstadtium; D s; not indicated; solid; and 281.” Group 11 contains “111; roentgenium; R g; not indicated; solid; and 282.” Group 12 contains “112; copernicium; C n; metal; liquid; and 285.” Group 13 contains “113; ununtrium; U u t; not indicated; solid; and 285.” Group 14 contains “114; flerovium; F l; not indicated; solid; and 289.” Group 15 contains “115; ununpentium; U u p; not indicated; solid; and 288.” Group 16 contains “116; livermorium; L v; not indicated; solid; and 293.” Group 17 contains “117; ununseptium; U u s; not indicated; solid; and 294.” Group 18 contains “118; ununoctium; U u o; not indicated; solid; and 294.”

Figure 2.26 Elements in the periodic table are organized according to their properties.

Originalseite · Copyright Rice University, OpenStax · CC BY-NC-SA 4.0 · unverändert
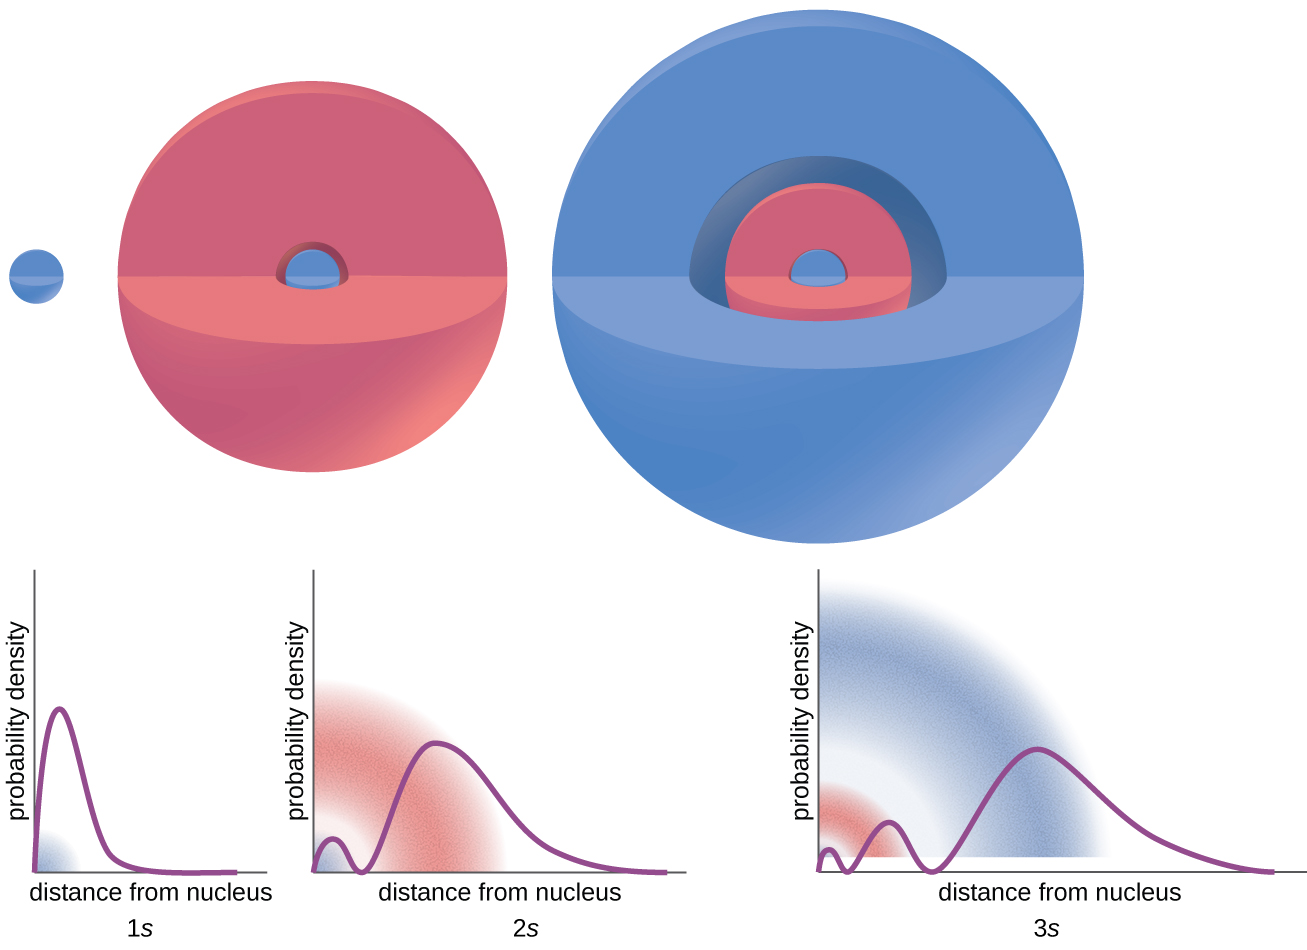
Dokument 2–3: räumliche Verteilung; keine festen Elektronenbahnen.

This figure provides images and graphs to illustrate the probability of finding an electron in 1 s, 2 s, and 3 s orbitals as a function of the distance from the nucleus. The 1 s orbital is shown as a sphere with a chunk missing. The graph below it has x axis labeled “distance from nucleus” and y axis labeled “probability density”. The related curve quickly reaches a maximum height and rapidly declines. The label, “1 s” appears below the graph. The 2 s orbital is shown as a red sphere with a blue middle. A chunk is missing from the sphere. The graph below it has x axis labeled “distance from nucleus” and y axis labeled “probability density”. The related curve quickly reaches a relative maximum height, a significantly higher absolute maximum height, and then rapidly declines. The label “2s” appears below it. The 3 s orbital is a blue sphere with a red sphere and another blue sphere at its core. The graph below it has x axis labeled “distance from nucleus” and y axis labeled “probability density”. The related curve quickly reaches a relative maximum height, a second relative maximum height, a significantly higher absolute maximum, and then declines more gradually than illustrated in the previous 2 graphs. The label, “3 s,” appears below the graph.

Figure 6.20 The graphs show the probability ( y axis) of finding an electron for the 1 s , 2 s , 3 s orbitals as a function of distance from the nucleus.

Originalseite · Copyright Rice University, OpenStax · CC BY-NC-SA 4.0 · unverändert
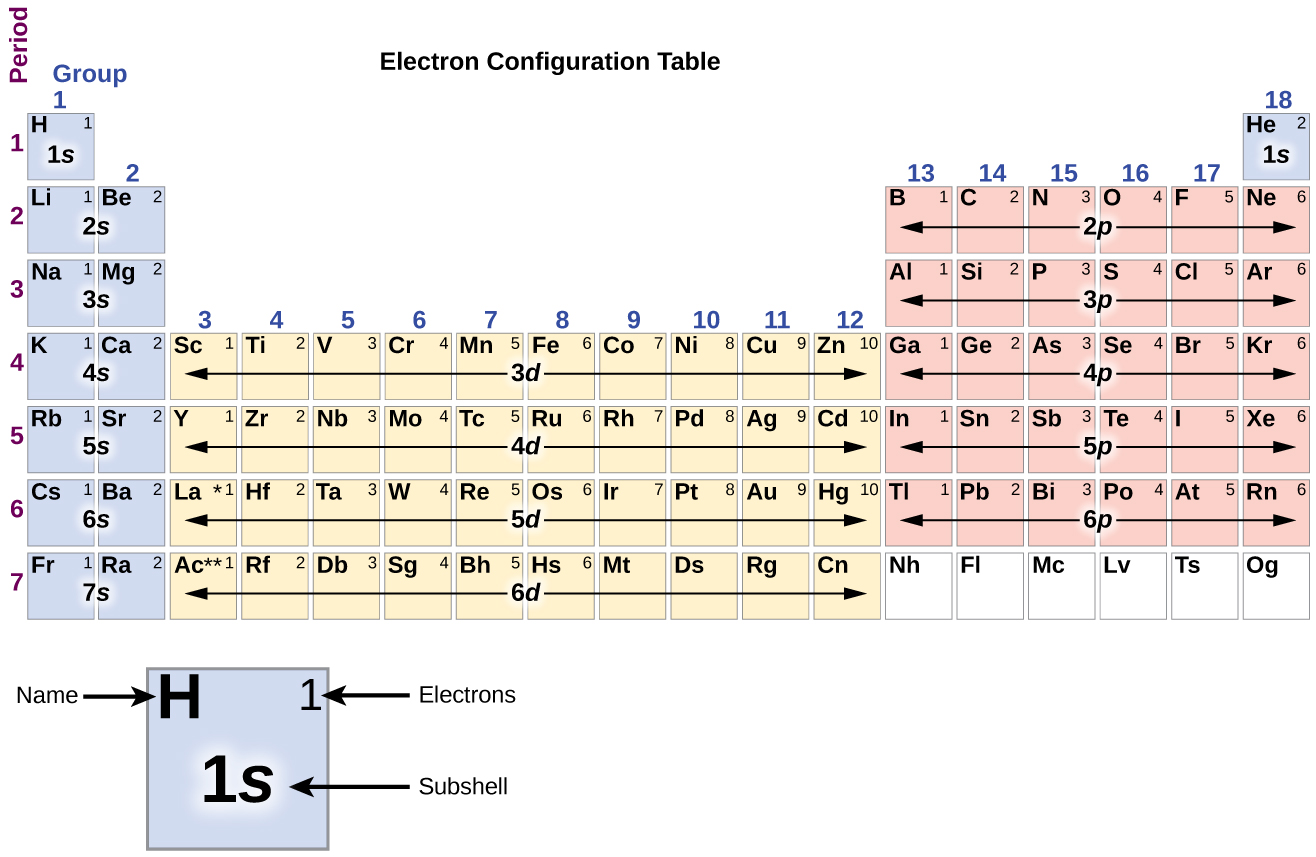
Dokument 2: Blockstruktur; als Aufbauhilfe, nicht als ausnahmslose Konfigurationstabelle.

In this figure, a periodic table is shown that is entitled, “Electron Configuration Table.” Beneath the table, a square for the element hydrogen is shown enlarged to provide detail. The element symbol, H, is placed in the upper left corner. In the upper right is the number of electrons, 1. The lower central portion of the element square contains the subshell, 1s. Helium and elements in groups 1 and 2 are shaded blue. In this region, the rows are labeled 1s through 7s moving down the table. Groups 3 through 12 are shaded orange, and the rows are labeled 3d through 6d moving down the table. Groups 13 through 18, except helium, are shaded pink and are labeled 2p through 6p moving down the table.

Figure 6.27 This partial periodic table shows electron configurations for the valence subshells of atoms. By “building up” from hydrogen, this table can be used to determine the electron configuration for atoms of most elements in the periodic table. (Electron configurations of the lanthanides and actinides are not accurately predicted by this simple approach. See Figure 6.29 .)

Originalseite · Copyright Rice University, OpenStax · CC BY-NC-SA 4.0 · unverändert
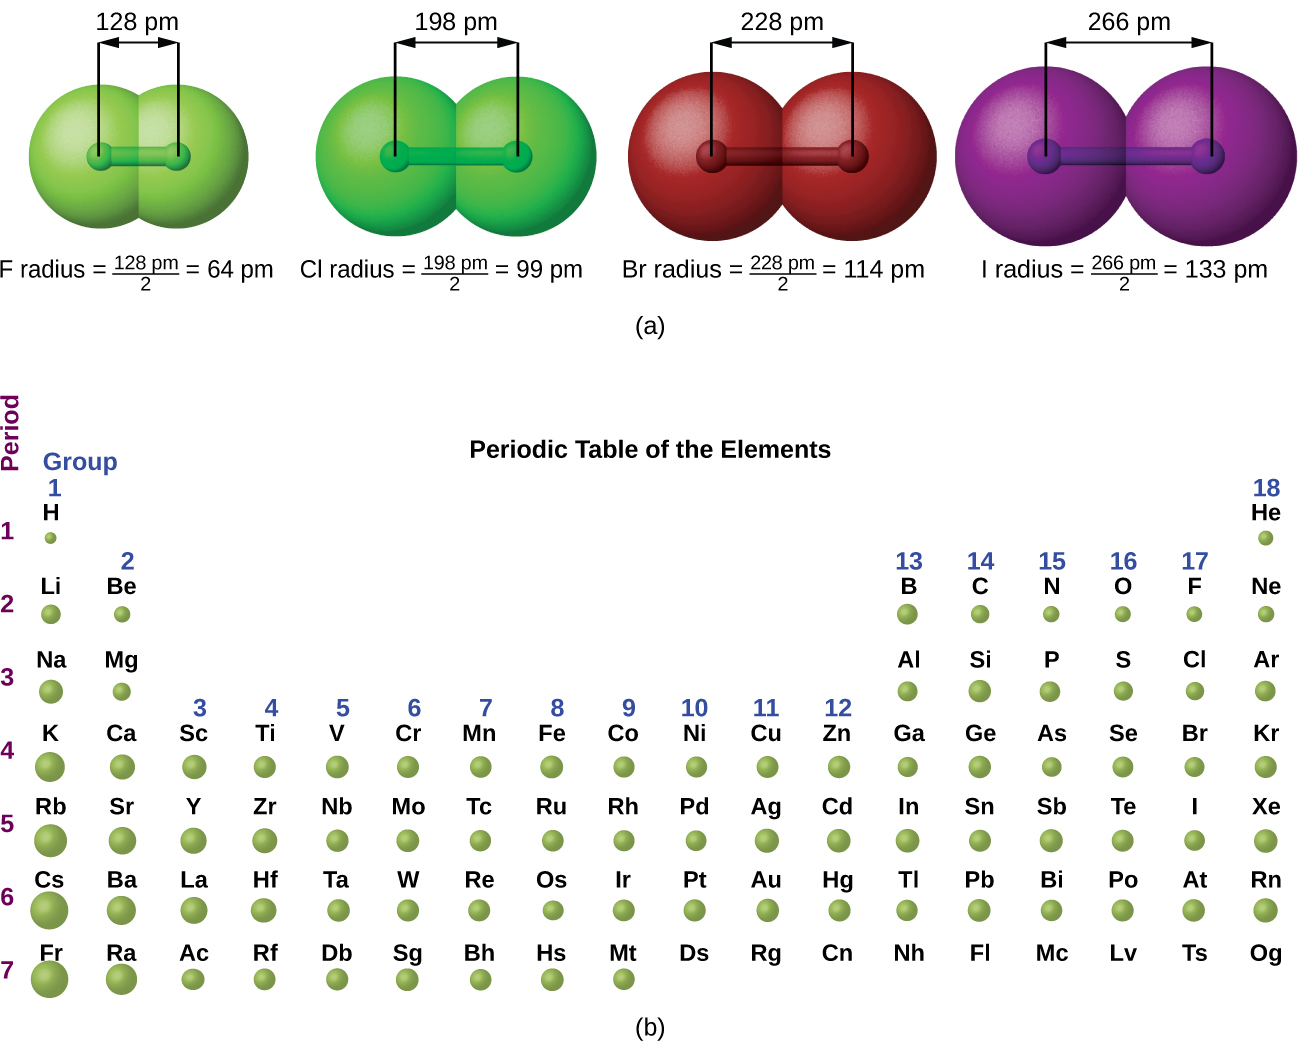
Dokument 3: Größenvergleich; Radiusdefinition und Datengrundlage vor Zahlenübernahme prüfen.

This figure has two parts: a and b. In figure a, four diatomic molecules are shown to illustrate the method of determining the atomic radius of an atom. The first model, in light green, is used to find the F atom radius. Two spheres are pushed very tightly together. The distance between the centers of the two atoms is indicated above the diagram with a double-headed arrow labeled “128 picometers (pm).” The end points of this arrow connect to line segments that extend to the atomic radii below. Beneath the molecule is the label, “F radius equals 128 pm divided by 2 equals 64 pm.” The next three models are similarly used to show the atomic radii of additional atoms. The second diatomic molecule is in a darker shade of green. The distance between the radii is 198 pm. Beneath the molecule is the label, “Cl radius equals 198 pm divided by 2 equals 99 pm.” The third diatomic molecule is in red. The distance between the radii is 228 pm. Beneath the molecule is the label, “Br radius equals 228 pm divided by 2 equals 114 pm.” The fourth diatomic molecule is in purple. The distance between the radii is 266 pm. Beneath the molecule is the label, “I radius equals 266 pm divided by 2 equals 133 pm.” In figure b, a periodic table layout is used to compare relative sizes of atoms, using green spheres. No spheres are provided for the noble or inert gas—group 18 elements. General trends noted are increasing circle size moving from top to bottom in a group, with a general tendency toward increasing atomic radii toward the lower left corner of the periodic table.

Figure 6.30 (a) The radius of an atom is defined as one-half the distance between the nuclei in a molecule consisting of two identical atoms joined by a covalent bond. The atomic radius for the halogens increases down the group as n increases. (b) Covalent radii of the elements are shown to scale. The general trend is that radii increase down a group and decrease across a period.

Originalseite · Copyright Rice University, OpenStax · CC BY-NC-SA 4.0 · unverändert
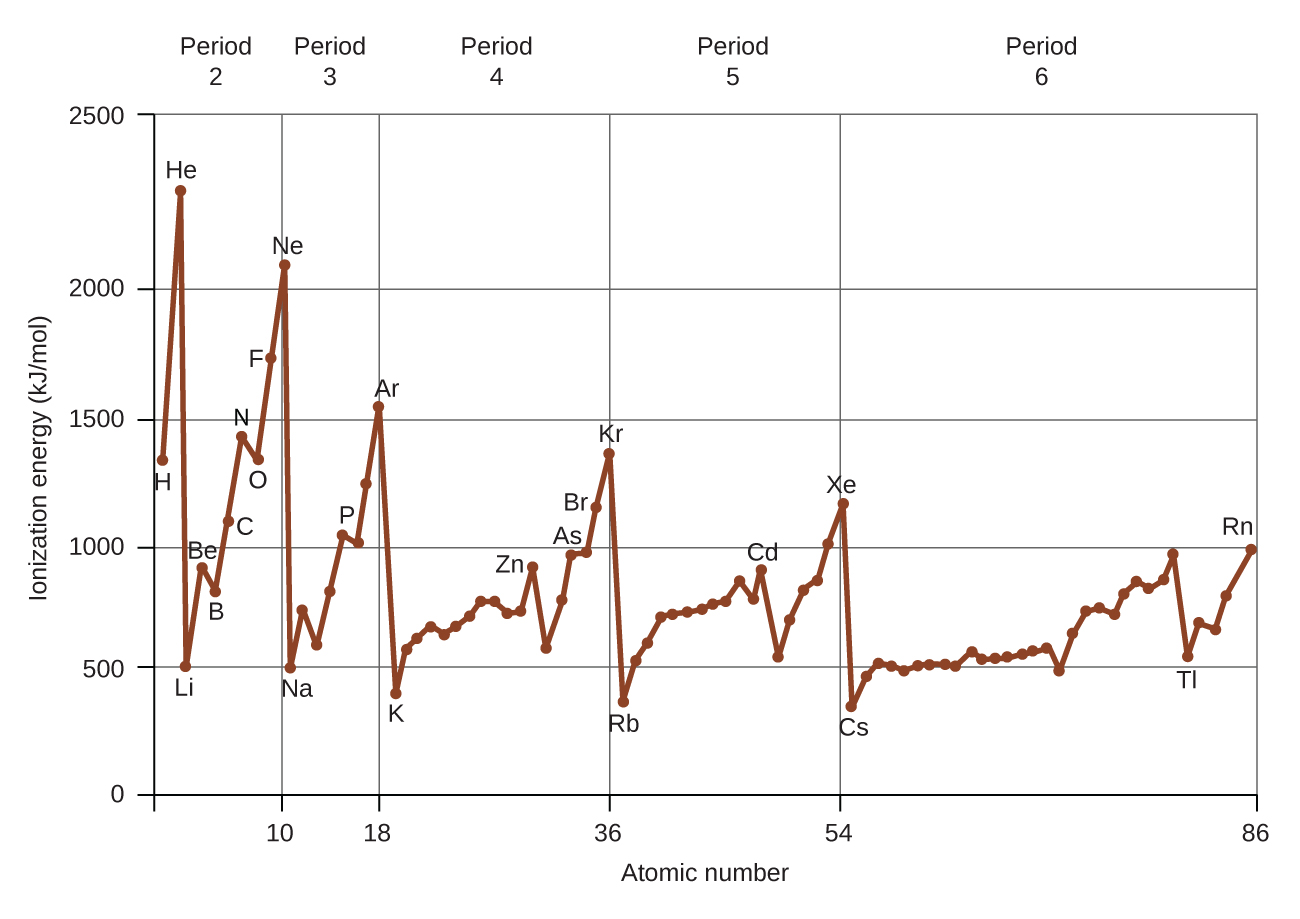
Dokument 3: Trend und Abweichungen; Einstieg mit einer einzelnen Periode.

This figure includes a graph labeled, “Atomic Number,” on the horizontal axis and, “Ionization Energy (k J divided by mol),” on the vertical axis. Markings are provided on the horizontal axis at 10, 18, 36, 54, and 86. Vertical lines extend from the horizontal axis upward at each of these values. The vertical axis begins at 0 and increases by 500’s up to 2500. Horizontal lines are drawn across the graph at multiples of 500. A red jagged line connects the ionization energies for elements with atomic numbers 1 through 86 on the graph. Peaks are evident at the locations of the noble or inert gases: H e, N e, A r, K r, X e, and R n. Similarly, minima exist at the locations of the alkali metals: L i, N a, K, R b, and C s. Elements labeled on the graph and their associated ionization energies are as follows: H 1310, H e 2370, L i 520, B e 900, B 800, C 1090, N 1400, O 1310, F 1680, N e 2080, N a 490, M g 730, P 1060, A r 1520, K 420, Z n 910, A s 960, B r 1140, K r 1350, R b 400, C d 870, X e 1170, T l 590, and R n 1030.

Figure 6.33 The first ionization energy of the elements in the first six periods are plotted against their atomic number.

Originalseite · Copyright Rice University, OpenStax · CC BY-NC-SA 4.0 · unverändert